Python is one of the most useful programming languages. Edureify, the best AI Learning App provides the best online coding courses that teach students everything related to Python, its tools, and frameworks.
In this article, Edureify will provide information on Matplotlib in Python, an important Python library used for the 2D plotting of arrays. Read on to know more.
What is Matplotlib in Python?
Matplotlib is an extension of NumPy. It is a library of Python that helps in data visualization and graph plotting. Matplotlib can support dynamic graphs and plots. It is an effective alternative for MatLab that is open source and works with NumPy.
Pyplot of Matplotlib
Matplotlib has a module named Pyplot that has features that enable plotting to be easy. Pyplot has features like front properties, controlling line styles, formatting axes, and more.
Use of Matplotlib
The primary use of Matplotlib is plotting graphs in Python. Matplotlib is a Python library that integrates object-oriented APIs for plotting in applications.
How to install Matplotlib?
Matplotlib is not in-built in Python. One needs to install it in their Python environment to use it efficiently.
Following are the steps to install Matplotlib using Anaconda Distribution of Python-
- Visit the official website of Anaconda and click on the download button
- Choose your version of the application based on your browser- Microsoft, IOS, or Linux
One can also download Matplotlib using the conda prompt. One can open the conda prompt and type the following-
conda install matplotlib
One can further use the pip command to install this library. After opening the command prompt type the following-
pip install matplotlib
Finally, to ensure that Matplotlib is successfully installed, type the following-
import matplotlib matplotlib._version_ ‘3.1.1’
Types of graphs of Matplotlib
Matplotlib can create various plots. They are-
- Histogram
- Pie plot
- Area plot
- Bar graph
- Scatter plot
Examples of basic plots using Matplotlib
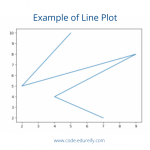
Example of Line Plot-
# importing matplotlib module

from matplotlib import pyplot as plt
# x-axis values
x = [5, 2, 9, 4, 7]
# Y-axis values
y = [10, 5, 8, 4, 2]
# Function to plot
plt.plot(x,y)
# function to show the plot
plt.show()
Output:

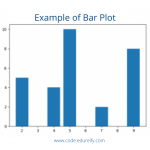
Example of Bar Plot:
# importing matplotlib module

from matplotlib import pyplot as plt
# x-axis values
x = [5, 2, 9, 4, 7]
# Y-axis values
y = [10, 5, 8, 4, 2]
# Function to plot the bar
plt.bar(x,y)
# function to show the plot
plt.show()
Output:

Example of Histogram:
# importing matplotlib module
from matplotlib import pyplot as plt
# Y-axis values
y = [10, 5, 8, 4, 2]
# Function to plot histogram
plt.hist(y)
# Function to show the plot
plt.show()
Output:

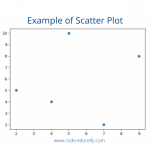
Example of Scatter Plot:
# importing matplotlib module
from matplotlib import pyplot as plt
# x-axis values
x = [5, 2, 9, 4, 7]
# Y-axis values
y = [10, 5, 8, 4, 2]
# Function to plot scatter
plt.scatter(x, y)
# function to show the plot
plt.show()
Output:

So here were the examples of Matplotlib.
Edureify has come with the best coding courses that teach students all the topics related to Python like-
- Python For Loops
- Pyscripts
- NumPy in Python and its arrays
- Central Limit Theorem with Python
- Gaussain distribution with Python
- SciPy in Python
- Global and local variables in Python, and more
Taking the certified coding courses of Edureify, students can also benefit from-
- 200+ learning hours
- Attend live lectures of the industry experts
- Get doubts cleared instantly
- Participate in real-life projects
- Get professional career guidance
Join the coding courses with Edureify and enhance your coding skills today.
Some FAQs on Matplotlib-
1. What is Matplotlib?
Matplotlib is a library of Python that helps in data visualization and graph plotting. Matplotlib can support dynamic graphs and plots. It is an effective alternative for MatLab that is open source and works with NumPy.
2. Is Matplotlib an extension of NumPy?
Yes, Matplotlib is an extension of NumPy.
3. What is Pyplot?
Matplotlib has a module named Pyplot that has features that enable plotting to be easy. Pyplot has features like front properties, controlling line styles, formatting axes, and more.
4. What are the types of graphs Matplotlib can make?
The following are the different types of graphs Matplotlib can make-
- Histogram
- Pie plot
- Area plot
- Bar graph
- Scatter plot
5. From where can I learn more about Matplotlib?
Edureify has the best coding courses that provide all the information on Matplotlib.
Master Your Coding Skills with BootSelf AI
If you're looking to enhance your coding abilities and upskill in artificial intelligence, look no further than the BootSelf AI app. This innovative platform provides AI-based coding lessons that are tailored to your individual learning pace.
Available on both iOS and Android, you can download the BootSelf AI app and start mastering coding skills today:


