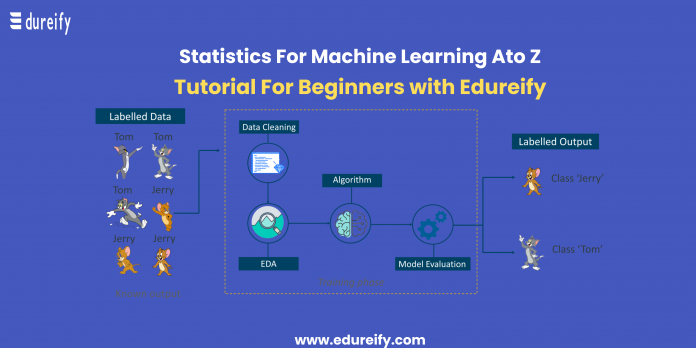
Data analytics and machine learning have statistics as their core component. Statistics is a key component that helps to analyze and visualize data and helps find unseen patterns. To use and learn the tricks of machine learning, statistics is one of the essential tools one needs to grasp as well.
In this article, Edureify, the best AI Learning App presents to you the concepts in statistics for machine learning. With our coding Bootcamp job-ready courses students can learn more about Machine Learning and Data Science. Read on to know more.
What is Statistics?
A branch of mathematics that deals with collecting, analyzing, interpreting, and visualizing pragmatic data is Statistics. As a subject and also a tool, statistics help a lot in technological uses, especially where data is the primary ground to work on.
There are two major areas of Statistics, that are-
- Descriptive Statistics– This refers to the methods that are used to describe the properties of sample and population data to organize and summarize the information in a data set. Descriptive Statistics give insight into what has happened.
- Inferential Statistics– This form of statistics deals with the methods to test hypotheses, reach conclusions, and make predictions. Inferential Statistics give insight into what to expect.
How does Machine Learning Incorporate Statistics?
Following are the way in which Statistics is used in Machine Learning-
- To ask questions about the data
- Cleans and preprocesses the data
- Selects the right features
- Evaluation of model
- Model prediction
Now that we have learned the basics of what is statistics and how it is used in Machine Learning, the following are more concepts regarding Statistics of Machine Learning.
Some features of Descriptive Statistics-
- Elements- Elements are the entities for which information is collected. They are also called cases or subjects.
- Variables- A variable is the characteristic of an element. They are also called attributes and can take different values for different elements. Variables can further be qualitative or quantitative.
o Qualitative- The variables that enable the elements to be classified or categorized according to some characteristics are called Qualitative variables. These are also called categorical variables.
o Quantitative- The variables that take numeric values and allow arithmetic functions to be performed on them are called Quantitative variables. These are also called numerical variables.
- Discrete Variable- A numerical variable in which each value can be graphed, a variable that can either take a finite or a countable number of values is a discrete variable.
- Continuous Variable- A continuous variable is a numerical variable that can take infinitely many values and whose possible values form an interval on the number line.
Population and Sample
- Population- Population in statistics comprises all the observations or the data points about a subject that is under study.
- Sample- Sample in statistics is a subject of the population. Out of the total observed population, the Sample is a small portion.
To describe the distribution of data using a single value, the measures of central tendency are used. The three measures of central tendency are Mean, Median, and Mode.
- Mean-
The average of all the data points is the arithmetic mean.
Consider the following example-
| Name | Salary | |
| 0 | Anderson | 50000 |
| 1 | Sara | 54000 |
| 2 | Will | 50000 |
| 3 | Rita | 189000 |
| 4 | Harry | 55000 |
| 5 | Frank | 40000 |
| 6 | Garry | 59000 |
One can use the mean () function in Python to find the mean or the average salary.
print(df[‘Salary’].mean())

71000.0
- Median–
The middle value that divides the data into two equal parts after sorting the data in the ascending order is the median.
Taking the example from the above data, using the median () function in Python one can find the median salary-
print(df[‘Salary’].median())

54000.0
- Mode–
The observation that occurs most frequently in a data set is the mode. There can be more than one mode in a dataset.
Again, taking the example of the above data, the mode of the salary is-
print(df[‘Salary’].mode())

0    50000

dtype: int64
Variance and Standard Deviation
One uses variance to calculate the variability in the data from the mean.
Here is an example-
| Name | Salary | Hours | Grade | |
| 0 | Anderson | 50000 | 41 | 50 |
| 1 | Sara | 54000 | 40 | 50 |
| 2 | Will | 50000 | 36 | 46 |
| 3 | Rita | 189000 | 17 | 95 |
| 4 | Harry | 55000 | 35 | 50 |
| 5 | Frank | 40000 | 39 | 5 |
| 6 | Garry | 59000 | 40 | 57 |
The following is used to calculate the variance of the Grade-
print(df[‘Grade’].var())

685.6190476190476
In statistics, Standard Deviation is the square root of the variance. Both Variance and Standard Deviation provide the measures of fit, i.e., how well the mean represents the data.
Using the std () function of Python, one can find the standard deviation-
print(df[‘Grade’].std())

26.184328282754315
In statistics, the difference between the maximum and the minimum value of the dataset is called the range.
Interquartile Range, IQR, measures the distance between the 1st quartile (Q1) and the 3rd quartile (Q3).
Skewness-
The shape of the distribution is measured by Skewness. When the proportion of data is at an equal distance from the mean or median, the distribution is symmetrical. It is right-skewed when the values extend to the right and it is left-skewed the values extend to the left.
Kurtosis-
To find out whether the tails of a given distribution have extreme values, Kurtosis is used. Kurtosis also presents the shape of a probability distribution.
For any random variable, the Gaussian Distribution is a popular continuous probability distribution. It is characterized by mean and standard deviation.
The features of Gaussian Distribution are-
- The mean, median, and mode are the same
- Is of a symmetrical bell shape
- 1 standard deviation of the mean contains 68% data
- 2 standard deviations of the mean contain 95% data
- 3 standard deviations of the mean contain 99.7% data
Taking a large random sample from the population with mean as µ and standard deviation as ō, according to the central limit theorem the distribution of the sample means will be roughly normally distributed, irrespective of the original population distribution.
So far, we have talked about some of the components of Statistics. In this section, we will talk about Hypothesis Testing, one of the most critical concepts in Machine Learning.
A statistical analysis that enables to process decisions using experimental data is Hypothesis Testing. Hypothesis testing allows one to statistically support some of the findings that were made while looking at the data. A claim is made during hypothesis testing that is usually about the population parameters like mean, median, standard deviation, and more.
Some of the essential features of hypothesis testing are-
- Null hypothesis (H0) is the assumption made for a statistical test.
- To contradict the null hypothesis, the Alternative Hypothesis (H1) states that the assumption does not stand true.
Hypothesis testing enables one to either retain or reject a null hypothesis.
Some of the popular hypothesis tests are-
- Chi-square test
- T-test
- Z-test
- Analysis of Variance (ANOVA)
Statistics is one of the most essential components of Machine Learning that enables to draw meaningful conclusions after critical data analysis. Learning about Artificial Intelligence and Machine Learning are two very important tools for evolving the knowledge of data-driven technology.
In this article, Edureify talked about the Statistics of Machine Learning. To further enhance one’s knowledge of Machine Learning, students can also read about Azure Machine Learning.
With Edureify’s coding Bootcamp job-ready courses, students can learn more about the important tools like Statistics that go into the working of data science such as learning Python, learning Java, and learning other programming languages like Ruby, Swift, Heroku, Golang, and more.
Some FAQs on Statistics of Machine Learning-
1. What is Machine Learning?
“Machine Learning is a type of Artificial Intelligence that allows software applications to be more accurate at predicting outcomes without being programmed to explicitly to do so.” To learn more about Artificial Intelligence and Machine Learning, read Edureify’s article on Artificial Intelligence and Machine Learning: the Two Boons of Data-Driven Technology.
2. What is statistics?
A branch of mathematics that deals with collecting, analyzing, interpreting, and visualizing pragmatic data is Statistics. As a subject and also a tool, statistics help a lot in technological uses, especially where data is the primary ground to work on.
3. What are the uses of Statistics in Machine Learning?
Following are the uses of statistics in machine learning-
- To ask questions about the data
- Cleans and preprocesses the data
- Selects the right features
- Evaluation of model
- Model prediction
4. What is Hypothesis Testing?
A statistical analysis that enables to process decisions using experimental data is Hypothesis Testing. Hypothesis testing allows one to statistically support some of the findings that were made while looking at the data. A claim is made during hypothesis testing that is usually about the population parameters like mean, median, standard deviation, and more.
5. From where can I learn more about statistics and machine learning?
Edureify has the best coding Bootcamp job-ready courses. Interested students can learn more about statistics and machine learning, along with other programming tools with Edureify.
Master Your Coding Skills with BootSelf AI
If you're looking to enhance your coding abilities and upskill in artificial intelligence, look no further than the BootSelf AI app. This innovative platform provides AI-based coding lessons that are tailored to your individual learning pace.
Available on both iOS and Android, you can download the BootSelf AI app and start mastering coding skills today:


